
Trading Strategy with EMA and RSI
Introduction
Exponential Moving Average (EMA) and Relative Strength Index (RSI) are two popular technical indicators used by traders to identify trends and potential reversal points in the market. By combining EMA and RSI, traders can create a reliable strategy for entering and exiting trades effectively. This article will guide you through the steps to implement this strategy and maximize your trading potential.
Understanding EMA and RSI
Exponential Moving Average (EMA)
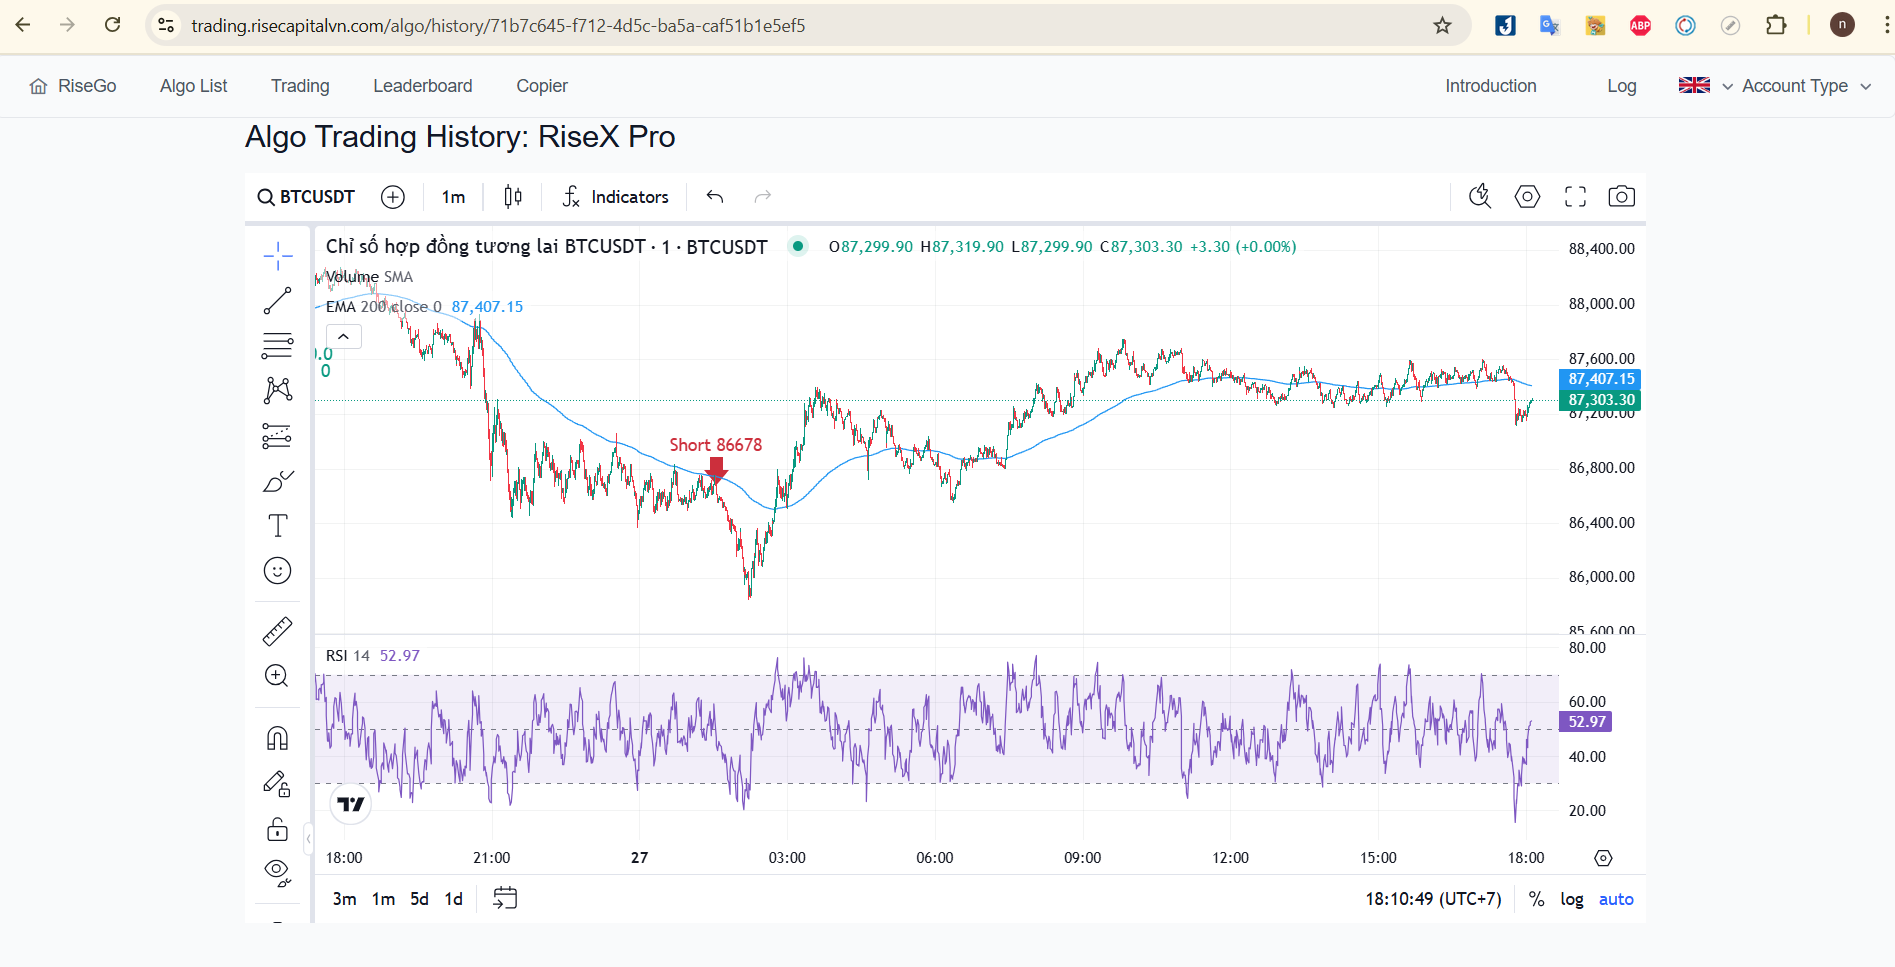
EMA is a type of moving average that places greater weight on recent prices, making it more responsive to price changes. It helps traders determine the overall market trend and identify potential entry points.
-
A short-term EMA (e.g., 9 or 20 periods) reacts quickly to price changes.
-
A long-term EMA (e.g., 50 or 200 periods) provides a broader trend perspective.
Relative Strength Index (RSI)
RSI is a momentum oscillator that measures the speed and change of price movements, ranging from 0 to 100.
-
RSI above 70 indicates an overbought condition, suggesting a possible price reversal or pullback.
-
RSI below 30 indicates an oversold condition, suggesting a potential buying opportunity.
How to Use EMA and RSI Together
Step 1: Choose Your EMAs
Select two EMAs for a crossover strategy:
-
Short-term EMA (e.g., 9-period EMA)
-
Long-term EMA (e.g., 50-period EMA)
Step 2: Identify the Trend
-
When the short-term EMA crosses above the long-term EMA, it signals an uptrend.
-
When the short-term EMA crosses below the long-term EMA, it signals a downtrend.
Step 3: Confirm with RSI
-
Bullish Signal: If the EMA crossover indicates an uptrend and RSI is above 50 but below 70, it confirms a potential buying opportunity.
-
Bearish Signal: If the EMA crossover indicates a downtrend and RSI is below 50 but above 30, it confirms a potential selling opportunity.
Step 4: Entry and Exit Points
-
Buy Entry: When the short-term EMA crosses above the long-term EMA and RSI is in a favorable range (between 50 and 70).
-
Sell Entry: When the short-term EMA crosses below the long-term EMA and RSI is in a favorable range (between 30 and 50).
-
Exit Position: Consider exiting the trade when RSI reaches the overbought (above 70) or oversold (below 30) levels.
Example of EMA & RSI Strategy
Assume a trader applies the 9-period EMA and 50-period EMA on a Forex or Crypto chart:
-
The 9 EMA crosses above the 50 EMA, signaling an uptrend.
-
RSI is at 55, confirming bullish momentum.
-
The trader enters a long position and holds until RSI reaches 70.
Advantages of This Strategy
-
Simple and Effective: Easy to implement for traders of all experience levels.
-
Reduces False Signals: Using EMA and RSI together helps filter out unreliable trade signals.
-
Applicable to Multiple Markets: Suitable for Forex, stocks, and cryptocurrency trading.
Conclusion
The combination of EMA and RSI provides a powerful trading strategy that helps traders identify trends, optimize entry points, and exit with confidence. By applying this strategy consistently, traders can improve their market analysis and enhance profitability.
Are you ready to test this strategy? Try it on your demo account before applying it to real trades!